Density distribution analysis
We can get various kinds of elemental density distribution from a light element to a heavy element without using the neutron.
Our CT device based on MIRRORCLE and microtron is suited for measuring the density distribution of various objects.
Imaging example : histogram of grey values obtained from a CT image of metal rods
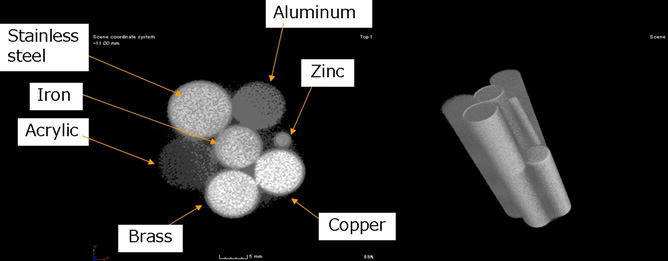
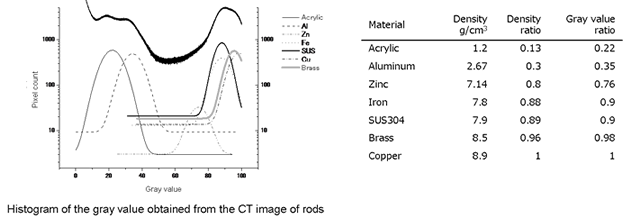
The density ratio based on copper is calculated and compared to grey values. The density ratios and grey values exhibit very good agreement.The margin of error is greater for low-density materials such as acrylic.
If the difference in density is around 0.4 g/cm3, such as between copper and brass, they can be clearly differentiated.
Analysis example : CT image of a titanium turbine blade
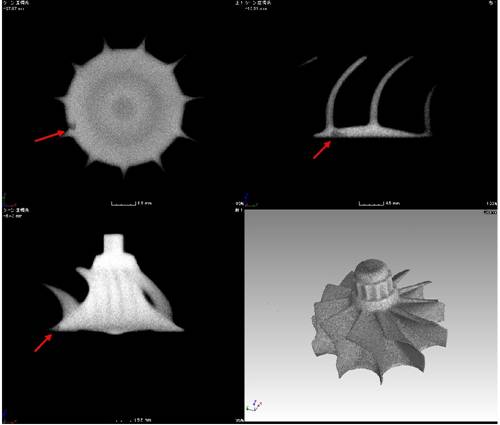
This is a sample in which an oxide is intentionally embedded in the section pointed by the arrow.
The slight difference in density is clearly visible.
| Light source | Microtron |
X-ray energy |
1,4,6MeV |
| Detector | Flat panel detector |
| maximum sample size | 50 x 50 x 50cm |
| resolution | 0.3mm |